
Page 11 - Perpustakaan Lemhannas RI
P. 11
LAMPIRAN II
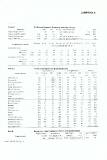
Part A.1 T ariffs and imports: Summary and duty ranges
Su m m ary Total Ag Non-Ag WTO member since 1995
Sirrple average final bound 95.8
Sinple average MFN applied 37.1 47.1 35.5 Binding coverage: Total 95.1
Trade weighted average Non-Ag
Imports in billion US$ 2010 j 6.8 8.4 6.6 1.0
0.7
2009 2.4 3.4 2.2 Ag: Tariff quotas (in %)
2009 91.2 16.1 75.1 Ag: Special safeguards I[in % )
Duty-free 0 <= 5 5 <= 10 10 <= 15 15 <= 25 25 <= 50 50 <= 100 > 100 ] NAV
T ariff lines and import values (in %) in %
Frequency distribution 0 3.2
0 71.5 0.6 0 0 87.5 8.7 2.0 0
Agricultural products 13.7 19.5 7.8 0.2 0.0 1.3
Final bound 2010 65.8 10.6 2.7 1.7 0.5 0.0 10.2
MFN applied 2009; 0 0.0
Inp o rts 41.6 1.6 2.5 0.0 0.0 0
14.8 0.0 0
Non-agricultural products 2.8 0.1 3.6 0 88.6 0.0 0
Final bound 23.8 0
MFN applied 2010 ' 77.5 17.0 15.7 1.4 0.5 0
knports 2009 !
3.8 3.3 0.5 0.1
Part A.2 Tariffs and inport s by product groups
Final bound duties MFN applied duties Imports
Product groups AVG Duty-free Max Binding AVG Duty-free Max Share Duty-free
in % in % in % in % in %
Animal products 43.8 0 50 100 4.4 16.2 25 0.4 66.3
Dairy products 74.0 0 210 100 5.5 0 10 0.3 0
Fruit, vegetables, plants 45.6 0 60 100 5.9 6.2 25 1.5 0.5
Coffee, tea 46.0 0 60 100 8.3 4.2 15 0.1 0.1
.C-e-r-e-a-l-s--&--p re paratio n s ------- ------------ 44.8 0 160 100 5.8 6.8 150 7.0 83.2
.
•
Oilseeds, fats & oils 39.9 0 60 100 3.9 38.4 10 4.6 89.9
Sugars and confectionery 58.3 0 95 100 7.1 0 23 1.8 0
Beverages & tobacco 81.3 0 150 100 51.8 1.1 150 0.2 0.0
Cotton 37.4 0 40 100 4.0 20.0 5 0.6 99.2
40.7 0 60 100
Other agricultural products 4.2 23.1 15 1.2 65.5
Fish & fish products 40.0 0 40 100 5.8 5.0 15 0.3 27.1
Minerals & metals 38.9 0.1 40 97.4 6.4 19.7 30 24.0 61.0
Petroleum 40.0 0 40 100 0.3 95.0 5 37.8 99.6
Chemicals 37.9 0.1 60 95.8 5.2 22.1 150 9.7 52.2
Wood, paper, etc. 39.4 0 40 99.6 5.0 27.8 15 5.0 78.7
Textiles 26.4 0 40 99.7 9.3 1.0 25 0.8 9.3
Clothing 35.0 0 40 100 14.3 0.6 15 0.0 0
39.7 0 50 99.4 8.9 13.3 25
Leather, footw ear, etc. 0.5 5.5
Non-electrical machinery 34.9 6.6 40 96.7 2.3 70.7 15 1.8 56.7
30.6 23.0 40 96.5 5.8 32.7 15
Electrical machinery 38.7 40 43.9 10.6 39.3 50 0.7 31.5
35.4 0 40 86.1 6.9 18.2 15
Transport equipment 9.5 1.6 71.4
Manufactures, n.e.s. 0.2 6.7
Part B Exports to major trading partners and duties faced
Major m a rk e ts Bilateral imports Diversification MFN A V G of Pref. Duty-free imports
stat.wto.org/TariftProfiles/ID_e.htin
in million 95% trade in no. of traded TL margin TL Value
US$ HS 2-digit HS 6-digit Simple Weighted Weighted in % in %